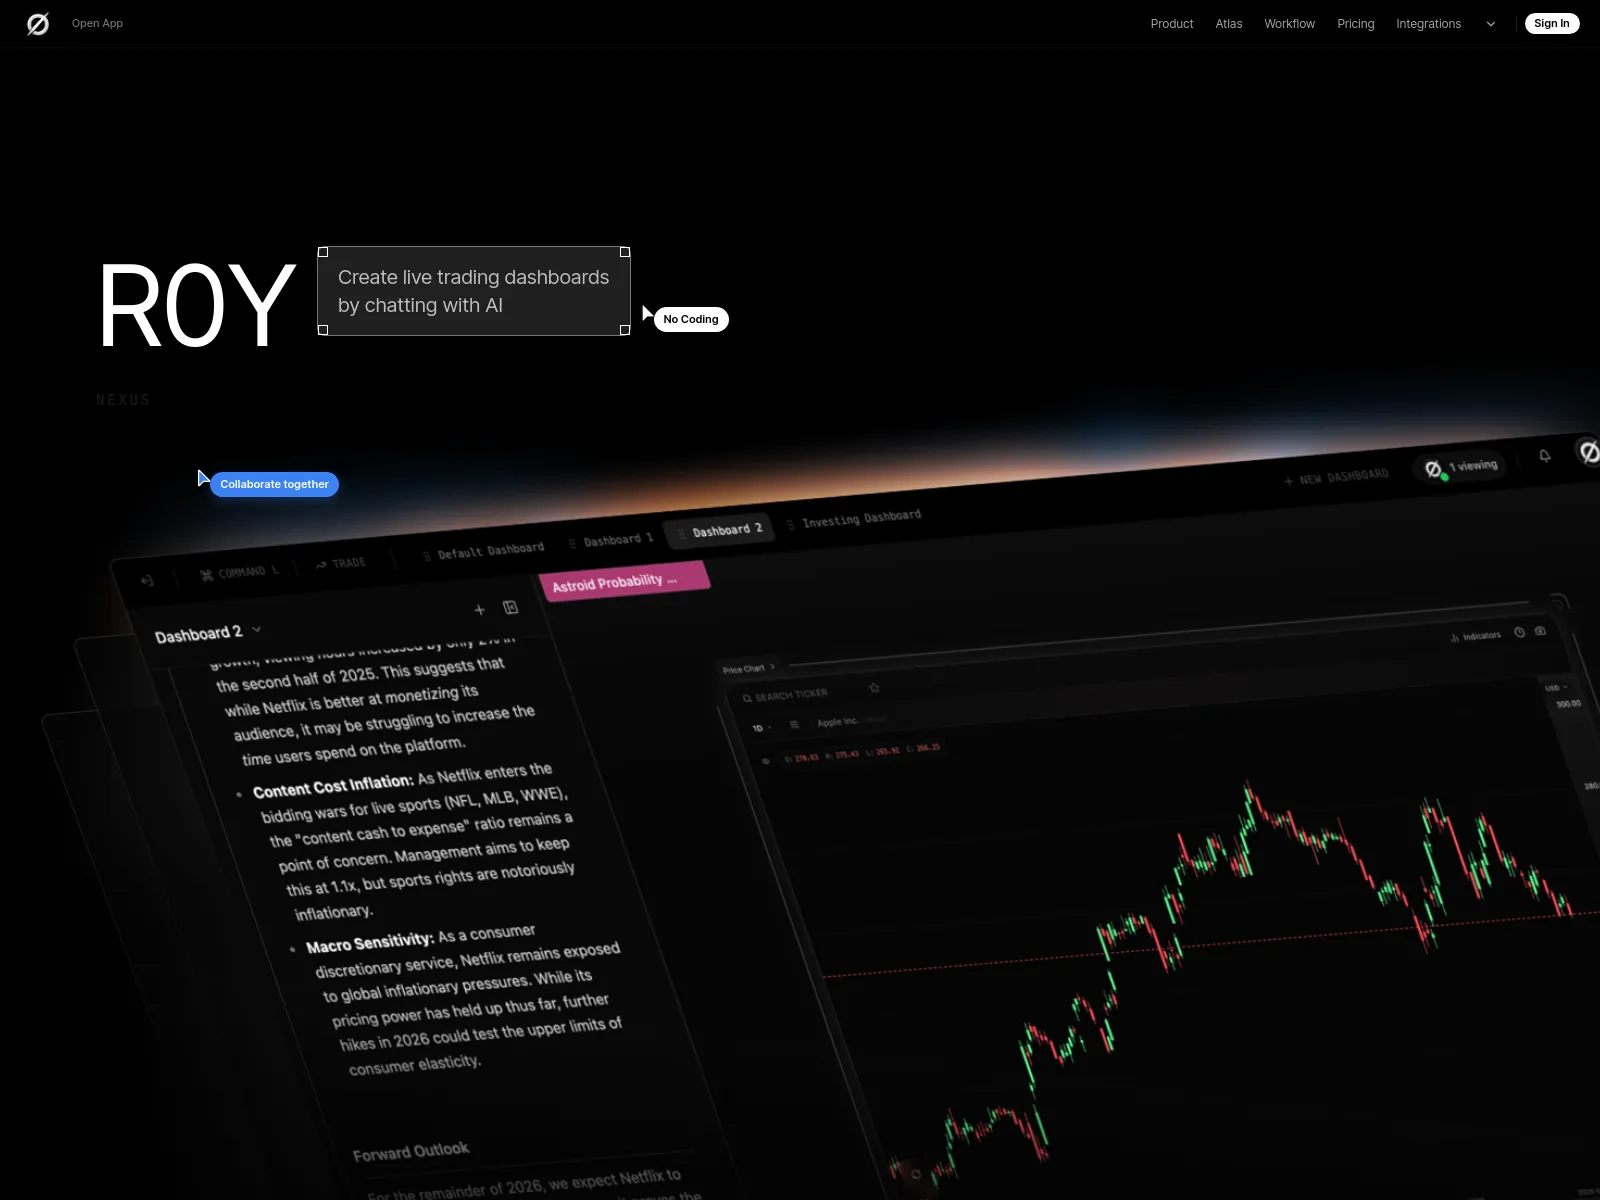
R0Y Financial Dashboard
Interactive financial dashboard for analyzing market data with custom widgets.
R0Y Financial Dashboard is a web-based tool that provides real-time financial data visualization and analysis. Users can create customizable dashboards with various widgets, including charts, tables, and maps, to track stocks, currencies, and economic indicators. It supports multiple data sources and offers interactive features for in-depth market research.
Free
How to use R0Y Financial Dashboard?
Sign up or log in to access the dashboard. Add widgets by selecting from available modules like price charts or heat maps. Configure each widget with your preferred data source and parameters. Drag and drop to arrange the layout. Save your dashboard for quick access. Use the built-in search and filter tools to explore market data.
R0Y Financial Dashboard 's Core Features
R0Y Financial Dashboard 's Use Cases
R0Y Financial Dashboard 's FAQ
Most impacted jobs
Financial Analyst
Investor
Trader
Economist
Data Analyst
R0Y Financial Dashboard 's Tags
#financial dashboard#market data#real-time analytics#stock tracking#investment tools#data visualization#business intelligence